
We know very well how the war has affected Ukrainians’ views. We know how their trust in various institutions (the President, the government, the Armed Forces of Ukraine, the police) and in one another has changed, and how the importance of democracy and life satisfaction has shifted. But does it affect the worldview of people beyond Ukraine’s borders? How has it changed Europeans, especially in countries that do not border Russia or Ukraine?
To understand this, sociologists study attitudes. An attitude is not a fleeting mood but a relatively stable orientation—an evaluation of people and events around us. Previous studies have already sought to answer how Europeans’ attitudes have changed in the context of the war in Ukraine. In particular, Klymak and Vlandas, in their paper Do wars abroad affect attitudes at home?, documented a “first shock” effect. Analyzing data from the 10th wave of the European Social Survey (ESS) in eight countries, where interviews were conducted between May 2021 and May 2022, the authors found that the war in Ukraine increased the importance of democracy and weakened authoritarian attitudes. Emotional attachment to Europe rose after March 2022. However, support for European unification and positive evaluations of immigration’s impact on the economy and culture increased only briefly: by April 2022, they had already returned to their previous levels.
However, the authors limited their analysis to only the first 60 days after the invasion. They showed that some changes were an immediate reaction, while others (such as attachment to Europe) emerged later. But what happens to attitudes in the medium and long term? With newly available data from the 11th wave of the ESS, we are able to assess this.
Data and methodology
For the analysis, we used data from the 10th (2020–2022) and 11th (2023–2024) waves of the ESS. Similar to Klymak and Vlandas, we selected only those countries where interviews were conducted face-to-face and covered periods before and after the start of the full-scale invasion. However, the geographic scope of the study changed somewhat. First, Belgium, Ireland, and the United Kingdom were added to the sample, as their data became available only after the original article had been written. Second, we excluded North Macedonia because it did not participate in the 11th wave. As a result, our analysis focuses on 10 countries (see Appendices 1–2 for the full list).
The list of attitudes also had to be adjusted. Of the original 12 indicators, we retained 8 for analysis. The main reasons for these changes were:
- Technical constraints: The 11th-wave questionnaire does not include questions on the importance of democracy or the need for strong leaders who are above the law.
- Sampling logic: The question of joining or leaving the EU is not universal, as some of the countries in our sample are already EU members while others are not. Respondents in EU member states were asked about their country leaving the EU, whereas respondents in the remaining countries were asked about joining the EU.
- Absence or short-lived effects: Klymak and Vlandas showed that the desire to leave the EU changed only during the first two weeks of the invasion, while the war did not affect the desire to join the EU at all.
The 8 attitudes we selected can be broadly divided into two equal groups: political attitudes (emotional attachment to Europe, support for European unification, and evaluations of government) and those related to immigration. To track changes after the invasion, we created a variable covering six time intervals:
- before the invasion;
- up to 1 month after the invasion began;
- from 1 to 3 months after the invasion began;
- from 3 to 6 months after the invasion began;
- from 6 months to 1.5 years after the invasion began;
- 1.5 years or more after the invasion began.
This breakdown allows us to capture short-term (up to 3 months), medium-term (from 3 months to 1.5 years), and long-term (1.5 years or more) periods.
To compare the “before” period with the “after” periods, we used hierarchical linear regression with mixed effects. The regression models were estimated on a pooled dataset including all countries simultaneously rather than separately for each country. Although analyzing individual countries can provide valuable information, our goal is to identify the overall trend in attitude change across European countries that do not border Ukraine or Russia. The chosen method allows us to separate the effect of survey timing from the effect of country of residence. The data structure enables analysis at both the individual (respondent) level and the country level. Individual-level variables were included in the model as fixed effects, while country was treated as a random effect.
We included control variables in the regression to account for individual differences among respondents. These include gender, age, years of education, type of settlement (urban vs. rural), whether the respondent was born in the country of residence (yes/no), the main source of income (wages, pensions, social benefits, etc.), and its subjective assessment. We use the same set of control variables as Klymak and Vlandas.
Even preliminary comparisons of the 10th and 11th waves of the ESS (see Appendices 1–2) make it clear why it is so important to separate the effect of survey timing from country-specific differences. For example, support for European integration increased in the United Kingdom and Montenegro, while in Italy it decreased. In Portugal, assessments of migrants’ impact on the country’s cultural life worsened, whereas in Montenegro they remained stable. If you are interested in other European countries beyond these 10 and their comparison with Ukraine, or in other attitudes, we invite you to consult the publication comparing the 10th and 11th waves of the ESS at this link.
Estimation results
The full regression results are reported in Appendix 3. Below, we focus only on comparisons between the period before February 2022 and the periods after the invasion to illustrate changes in Europeans’ attitudes.
Figure 1. Results of the regression analysis of changes in political attitudes after the invasion compared to the period before February 2022
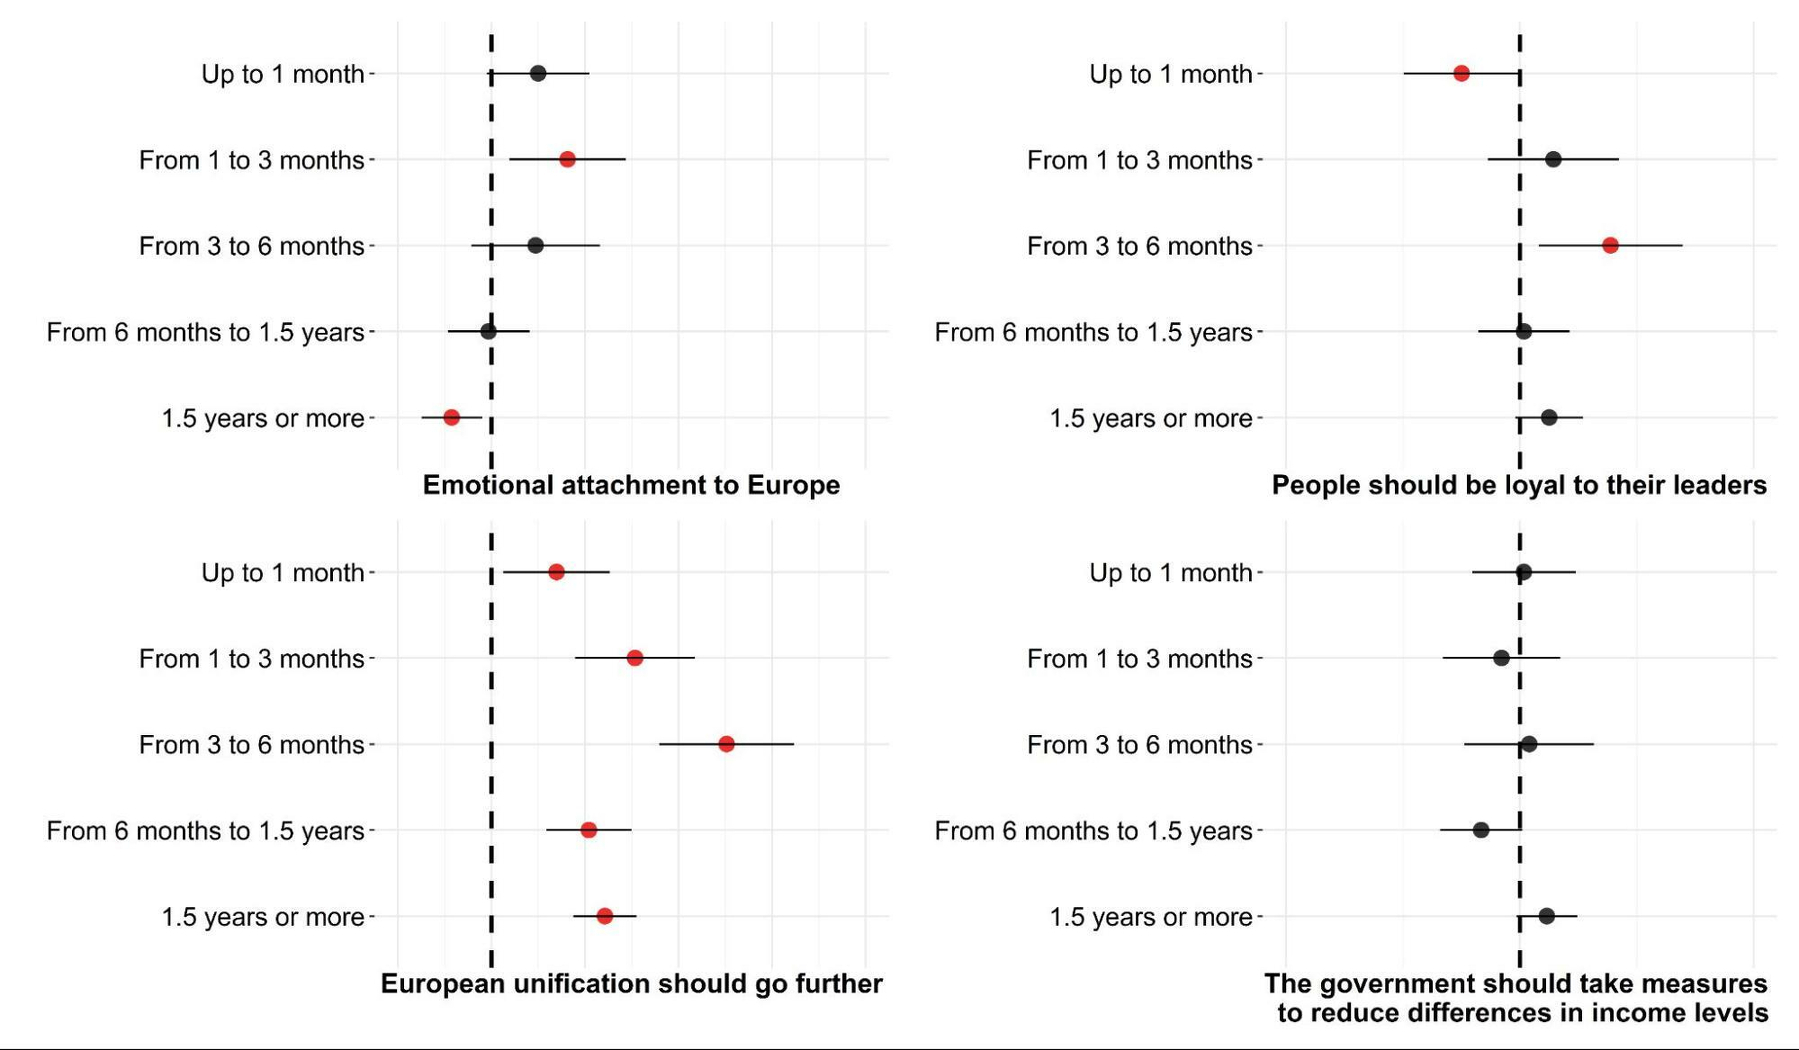
Note: The dots represent regression coefficients, and the horizontal lines represent their 95% confidence intervals. Statistically significant differences compared to the pre-invasion period are shown in red, while non-significant differences are shown in black. Points to the right of the vertical dashed line (zero) indicate more positive attitudes after the invasion, while points to the left indicate more negative attitudes.
As Figure 1 shows, support for further European unification increased after the invasion. This trend persists in both the short term and the long term. By contrast, emotional attachment to Europe changed over time: in the first 1–3 months, it was higher than its 2021 level, but after 1.5 years and later, it fell below the level observed before the invasion.
At the very beginning of the war, support for the idea that people should be loyal to their leaders weakened, but in the 3–6 month period, it exceeded pre-invasion levels. At the same time, support for government action to reduce income inequality remained the same as before the invasion.
Figure 2. Results of the regression analysis of changes in attitudes toward immigrants after the invasion compared to the period before February 2022
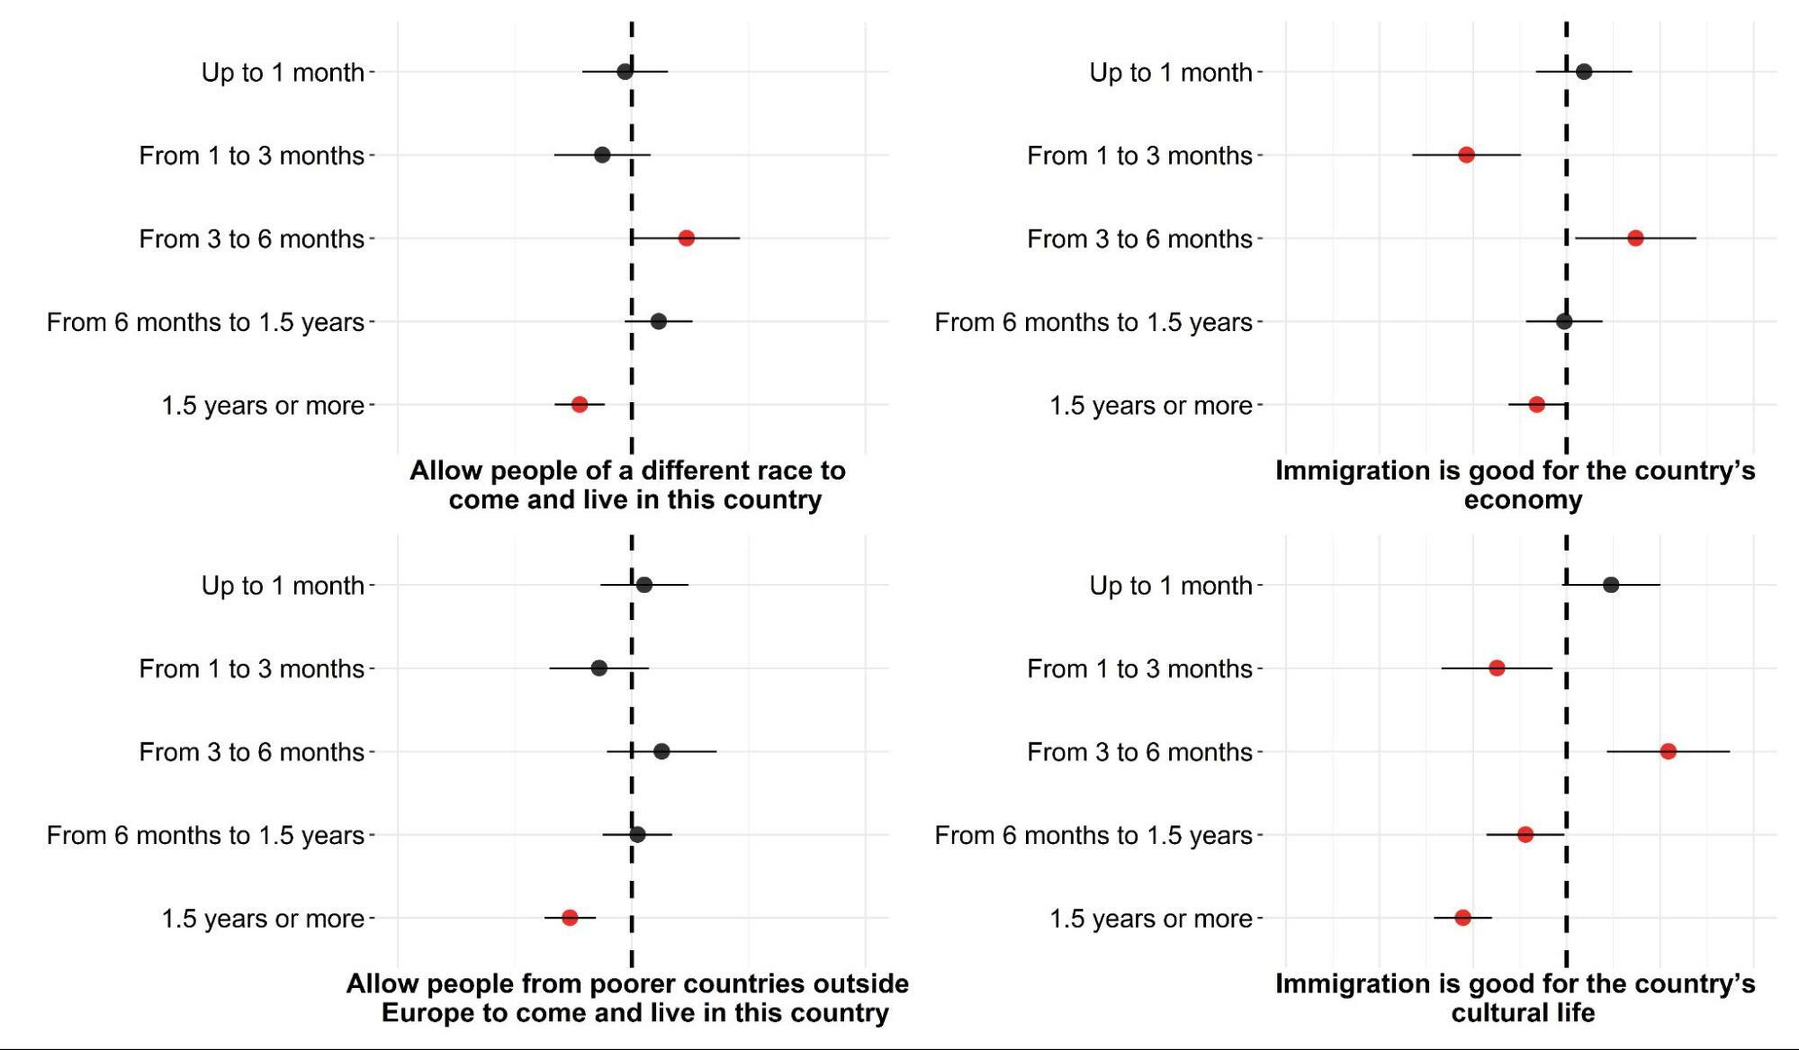
Note: The dots represent regression coefficients, and the horizontal lines represent their 95% confidence intervals. Statistically significant differences compared to the pre-invasion period are shown in red, while non-significant differences are shown in black. Points to the right of the vertical dashed line (zero) indicate more positive attitudes after the invasion, while points to the left indicate more negative attitudes.
Figure 2 shows that in the first month after the invasion, overall attitudes toward immigrants remained the same as before the invasion. However, there was one important nuance: in the first 1–3 months, Europeans became more skeptical about the positive impact of immigration on the country’s economy and cultural life, although support for allowing immigrants to enter the country did not decline.
Attitudes improved thereafter: in the 3–6 month period after the start of the full-scale invasion, both support for allowing immigrants of a different race or ethnic group to come and live in the country and positive views of immigration’s impact on the economy and culture increased. However, in the long term (after 1.5 years or more), attitudes deteriorated and fell below their 2021 level.
Next, we examine the relationship between attitudes and the control variables, focusing on those associated with all or most outcomes (see Appendix 3). More positive attitudes toward immigrants are associated with higher levels of education, greater financial comfort, living in urban areas, having wages as the main source of income (rather than social benefits or grants), and being born outside the current country of residence.
Stronger emotional attachment to Europe and more positive attitudes toward European unification are associated with higher levels of education, urban residence, greater financial comfort, and being born outside the country of residence. Higher support for European unification is also more common among those whose main source of income is wages rather than social benefits or grants.
By contrast, support for reducing income inequality is more common among respondents with lower financial comfort, those whose main source of income is social benefits or grants, and rural residents. Support for the idea that people should be loyal to their leaders is more common among rural residents, less educated respondents, and those whose main source of income is social benefits or grants, as well as among individuals with higher financial comfort.
Conclusions
The results suggest that the echo of the war can shift public opinion in countries that do not share borders with Ukraine or Russia—that is, where the threat would be expected to feel less immediate.
The most notable pattern is observed in attitudes toward immigrants. While in March 2022 these attitudes remained essentially at their pre-invasion level, there was a sharp “warming” in the 3–6 months following the full-scale invasion. However, in the long term (1.5 years or more), these attitudes fell below their pre-invasion level.
On the one hand, it can be assumed that overall attitudes toward immigrants are partly shaped by perceptions of Ukrainian refugees. In this case, the deterioration in attitudes may be linked to the protracted nature of the war: the longer it lasts, the more likely immigrants are to be perceived not as temporary guests in need of help, but as people who will remain for a long time. This implies that they will compete for jobs and place additional strain on the welfare system. At the same time, the impact of Russia’s information warfare—aimed at destabilizing European societies, including through the issue of migration—should not be underestimated.
Long-term changes are also evident in attitudes toward European unification and emotional attachment to Europe. Support for European unification remains consistently higher than its pre-invasion level. However, emotional attachment to Europe in the period 1.5 years or more after the start of the full-scale invasion fell below its pre-invasion level.
Such patterns may be driven by different reactions to the war:
- Shattered assumptions about a safe and predictable world: this may encourage greater support for European unification as a geopolitical bloc.
- Disappointment with insufficient decisiveness: some Europeans may believe that the EU provides too little assistance to Ukraine, which fuels skepticism toward it and reduces emotional attachment to Europe overall.
- A demand for “normality”: a desire to distance oneself from the war and preserve familiar comfort. In the media space, the EU often appears in the context of the Russia–Ukraine war (sanctions and support for Ukraine), which can trigger a defensive reaction—avoiding negative information. This may also reduce emotional attachment to Europe.
Study limitations
It is important to note that these results apply primarily to the 10 countries selected for analysis and cannot be automatically generalized to other European countries. In addition, the changes in attitudes observed after the invasion were not necessarily caused by it. While the war may still have been the dominant factor in the first months, in the long term the effect of the invasion becomes intertwined with other events and contexts. Moreover, because different individuals were interviewed in different periods, we capture overall trends rather than individual-level changes.
The preparation and publication of this material was supported by Documenting Ukraine, a project of the Institute for Human Sciences, IWM Vienna.
Appendix 1. Mean values of political attitudes in the 10th and 11th waves of the ESS for 10 countries
| Country | Emotional attachment to Europe (0 — Not at all, 10 — Very emotionally attached) |
European unification should go further or has already gone too far (0 — Unification has gone too far, 10 — Unification should go further) |
People should be loyal to their leaders¹ (1 — Agree strongly, 5 — Disagree strongly) |
The government should take measures to reduce differences in income levels¹ (1 — Agree strongly, 5 — Disagree strongly) |
||||
|---|---|---|---|---|---|---|---|---|
| ESS 10 | ESS 11 | ESS 10 | ESS 11 | ESS 10 | ESS 11 | ESS 10 | ESS 11 | |
| Belgium | 5.91 | 5.76 | 5.87 | 5.73 | 3.05 | 3.11 | 2.17 | 2.21 |
| Switzerland | 5.97 | 6.05 | 4.99 | 5.00 | 2.72 | 2.83 | 2.32 | 2.28 |
| United Kingdom | 4.77 | 4.87 | 5.08 | 5.41 | 3.28 | 3.33 | 2.13 | 2.18 |
| Greece | 5.32 | 5.24 | 5.05 | 5.22 | 3.78 | 3.55 | 1.76 | 1.66 |
| Ireland | 6.21 | 5.98 | 5.84 | 5.34 | 3.06 | 3.10 | 2.11 | 2.05 |
| Italy | 5.93 | 5.73 | 5.18 | 4.75 | 2.80 | 2.82 | 2.06 | 1.85 |
| Montenegro | 5.72 | 4.73 | 3.82 | 6.02 | 3.20 | 3.18 | 2.07 | 2.28 |
| Netherlands | 5.77 | 5.63 | 5.79 | 5.56 | 3.24 | 3.22 | 2.27 | 2.37 |
| Norway | 6.31 | 6.45 | 4.99 | 5.11 | 2.93 | 2.91 | 2.13 | 2.25 |
| Portugal | 6.55 | 6.69 | 6.21 | 6.37 | 3.00 | 3.11 | 1.70 | 1.74 |
|
Note: For data from the 10th and 11th waves of the ESS, post-stratification weights combined with design weights were applied. Statistically significant differences in mean values between survey waves (p ≤ 0.05), based on the Mann–Whitney test, are shown in bold. The test was conducted separately for each country across all eight attitudes, after which the Holm correction for multiple comparisons was applied. ¹ The lower the mean value, the stronger the agreement. |
||||||||
Appendix 2. Mean values of attitudes toward immigrants in the 10th and 11th waves of the ESS for 10 countries
| Country | Allow people of a different race or ethnic group to come and live in this country¹ (1 — Allow many, 4 — Allow none) |
Allow people from poorer countries outside Europe to come and live in this country¹ (1 — Allow many, 4 — Allow none) |
Immigration is good or bad for the country’s economy (0 — Bad, 10 — Good) |
Immigration is good or bad for the country’s cultural life (0 — Cultural life is undermined, 10 — Cultural life is enriched) |
||||
|---|---|---|---|---|---|---|---|---|
| ESS 10 | ESS 11 | ESS 10 | ESS 11 | ESS 10 | ESS 11 | ESS 10 | ESS 11 | |
| Belgium | 2.07 | 2.08 | 2.09 | 2.14 | 5.61 | 5.52 | 6.31 | 6.14 |
| Switzerland | 2.10 | 2.10 | 2.16 | 2.17 | 6.42 | 6.48 | 6.55 | 6.39 |
| United Kingdom | 1.86 | 1.99 | 1.93 | 2.05 | 6.70 | 6.39 | 6.69 | 6.53 |
| Greece | 3.08 | 2.89 | 3.12 | 3.06 | 4.06 | 4.16 | 4.14 | 4.06 |
| Ireland | 2.03 | 2.19 | 2.09 | 2.23 | 6.60 | 6.21 | 6.72 | 6.28 |
| Italy | 2.32 | 2.38 | 2.28 | 2.31 | 5.06 | 5.04 | 5.25 | 4.90 |
| Montenegro | 2.33 | 2.34 | 2.41 | 2.37 | 4.29 | 4.27 | 5.15 | 5.15 |
| Netherlands | 2.05 | 2.18 | 2.18 | 2.33 | 5.86 | 5.68 | 6.53 | 6.25 |
| Norway | 1.80 | 1.75 | 1.86 | 1.84 | 6.06 | 6.00 | 6.53 | 6.32 |
| Portugal | 2.21 | 2.47 | 2.19 | 2.44 | 6.35 | 6.21 | 6.21 | 5.64 |
|
Note: For data from the 10th and 11th waves of the ESS, post-stratification weights combined with design weights were applied. Statistically significant differences in mean values between survey waves (p ≤ 0.05), based on the Mann–Whitney test, are shown in bold. The test was conducted separately for each country across all eight attitudes, after which the Holm correction for multiple comparisons was applied. 1 The lower the mean value, the more positive the attitude. |
||||||||
Appendix 3. Regression models for the 8 attitude variables ✢
| (1) | (2) | (3) | (4) | (5) | (6) | (7) | (8) | |
|---|---|---|---|---|---|---|---|---|
| (Intercept) | 4.744***
(0.203) |
4.729***
(0.170) |
2.425***
(0.077) |
3.046***
(0.065) |
1.538***
(0.090) |
1.510***
(0.096) |
5.227***
(0.234) |
5.272***
(0.220) |
| Period: Up to 1 month | 0.100
(0.056) |
0.139*
(0.058) |
-0.050*
(0.025) |
0.004
(0.023) |
-0.006
(0.019) |
0.011
(0.019) |
0.038
(0.053) |
0.095
(0.054) |
| Period: From 1 to 3 months | 0.163*
(0.063) |
0.307***
(0.065) |
0.029
(0.029) |
-0.016
(0.026) |
-0.025
(0.021) |
-0.028
(0.022) |
-0.214***
(0.059) |
-0.149*
(0.061) |
| Period: From 3 to 6 months | 0.095
(0.070) |
0.503***
(0.073) |
0.078*
(0.031) |
0.008
(0.028) |
0.047*
(0.023) |
0.026
(0.024) |
0.148*
(0.066) |
0.218**
(0.067) |
| Period: From 6 months to 1.5 years | -0.006
(0.044) |
0.208***
(0.046) |
0.004
(0.020) |
-0.033
(0.018) |
0.023
(0.015) |
0.005
(0.015) |
-0.005
(0.042) |
-0.088*
(0.042) |
| Period: 1.5 years or more | -0.085*
(0.033) |
0.243***
(0.034) |
0.025
(0.015) |
0.023
(0.013) |
-0.045***
(0.011) |
-0.053***
(0.011) |
-0.063*
(0.031) |
-0.222***
(0.032) |
| Gender: Female | 0.120***
(0.026) |
-0.066*
(0.027) |
-0.022
(0.012) |
0.101***
(0.010) |
0.029***
(0.009) |
0.044***
(0.009) |
-0.198***
(0.024) |
0.103***
(0.025) |
| Age | 0.002*
(0.001) |
-0.007***
(0.001) |
0.004***
(0.000) |
0.000
(0.000) |
-0.006***
(0.000) |
-0.006***
(0.000) |
-0.004***
(0.001) |
-0.009***
(0.001) |
| Urban residence: No | -0.142***
(0.028) |
-0.236***
(0.029) |
0.077***
(0.012) |
-0.070***
(0.011) |
-0.078***
(0.009) |
-0.067***
(0.009) |
-0.180***
(0.026) |
-0.247***
(0.026) |
| Born in the country of residence: Yes | -0.460***
(0.042) |
-0.486***
(0.045) |
-0.181***
(0.019) |
0.032
(0.017) |
-0.244***
(0.014) |
-0.231***
(0.014) |
-1.048***
(0.040) |
-0.909***
(0.040) |
| Education (years of education) | 0.075***
(0.003) |
0.055***
(0.004) |
-0.039***
(0.002) |
0.000
(0.001) |
0.025***
(0.001) |
0.024***
(0.001) |
0.079***
(0.003) |
0.086***
(0.003) |
| Income source: Self-employment | 0.067
(0.052) |
-0.001
(0.054) |
-0.039
(0.023) |
-0.016
(0.021) |
-0.041*
(0.017) |
-0.044*
(0.018) |
-0.102*
(0.049) |
-0.085
(0.050) |
| Income source: Farming or household production | -0.053
(0.094) |
0.121
(0.097) |
-0.019
(0.042) |
-0.007
(0.038) |
-0.129***
(0.031) |
-0.055
(0.032) |
-0.056
(0.088) |
-0.063
(0.090) |
| Income source: Pension | 0.056
(0.041) |
0.107*
(0.043) |
0.097***
(0.019) |
0.035*
(0.017) |
0.010
(0.014) |
0.020
(0.014) |
0.006
(0.039) |
-0.025
(0.040) |
| Income source: Unemployment or redundancy benefits | -0.377**
(0.116) |
0.119
(0.127) |
-0.022
(0.052) |
0.007
(0.047) |
-0.117**
(0.039) |
-0.127**
(0.040) |
-0.260*
(0.109) |
-0.048
(0.112) |
| Income source: Other social benefits, subsidies, or grants | -0.116
(0.081) |
-0.308***
(0.086) |
0.110**
(0.036) |
0.181***
(0.033) |
-0.090***
(0.027) |
-0.112***
(0.027) |
-0.475***
(0.076) |
-0.363***
(0.077) |
| Income source: Investments, savings, insurance, or property | 0.386**
(0.145) |
0.138
(0.148) |
0.040
(0.065) |
-0.224***
(0.059) |
-0.029
(0.048) |
-0.037
(0.050) |
0.074
(0.135) |
-0.133
(0.140) |
| Income source: Other sources | -0.150
(0.101) |
-0.051
(0.104) |
-0.048
(0.045) |
0.008
(0.041) |
-0.006
(0.033) |
0.013
(0.034) |
0.088
(0.094) |
0.216*
(0.095) |
| Financial comfort | 0.215***
(0.018) |
0.130***
(0.018) |
0.035***
(0.008) |
-0.096***
(0.007) |
0.070***
(0.006) |
0.052***
(0.006) |
0.239***
(0.017) |
0.199***
(0.017) |
| SD (Intercept, country level) | 0.598 | 0.480 | 0.220 | 0.183 | 0.273 | 0.293 | 0.707 | 0.659 |
| SD (Observations) | 2.339 | 2.370 | 1.043 | 0.942 | 0.774 | 0.794 | 2.184 | 2.226 |
| Num.Obs. | 33225 | 31310 | 32834 | 33131 | 33015 | 32973 | 32814 | 32874 |
| R2 Marg. | 0.038 | 0.030 | 0.046 | 0.017 | 0.072 | 0.063 | 0.072 | 0.077 |
| R2 Cond. | 0.097 | 0.068 | 0.087 | 0.052 | 0.175 | 0.175 | 0.160 | 0.152 |
| AIC | 150908.3 | 143036.2 | 96145.1 | 90259.8 | 76961.1 | 78577.4 | 144546.7 | 146062.6 |
| BIC | 151084.9 | 143211.6 | 96321.5 | 90436.4 | 77137.6 | 78753.9 | 144723.0 | 146239.1 |
| ICC | 0.1 | 0.0 | 0.0 | 0.0 | 0.1 | 0.1 | 0.1 | 0.1 |
| RMSE | 2.34 | 2.37 | 1.04 | 0.94 | 0.77 | 0.79 | 2.18 | 2.22 |
|
✢Note: Regression models were estimated for the following dependent variables: (1) Emotional attachment to Europe; (2) European unification should go further or has already gone too far; (3) People should be loyal to their leaders; (4) The government should take measures to reduce differences in income levels; (5) Allow people of a different race or ethnic group to come and live in this country; (6) Allow people from poorer countries outside Europe to come and live in this country; (7) Immigration is good or bad for the country’s economy; (8) Immigration is good or bad for the country’s cultural life. Standard errors are reported in parentheses below the regression coefficients. All variables with reverse-coded scales were recoded so that higher values indicate more positive attitudes or evaluations. All ordinal and continuous variables that did not start at 0 were recoded to start at 0. The exception is age, which was centered so that its mean equals 0. Reference category for Period: Before the invasion; for Income source: Wages. * p < 0.05, ** p < 0.01, *** p < 0.001. |
||||||||
Photo: depositphotos.com